Leveraging Advertising Data For Behavioral Insights
- Fahad H

- Jun 6, 2013
- 3 min read
With marketing becoming increasingly programmatic, it is important to leverage every possible metric that can provide insights into customer behavior.
For digital marketers, this usually means analyzing site traffic data; but, advertising data can also be used to great value in behavioral analytics. In this article, I show one example of this type of analysis along with the results.
Distribution Of Click-To-Conversion Time
A metric common in all forms of digital advertising is click-to-conversion time, also known as conversion delay, which is the delay between when the ad was clicked to when the individual made a purchase.
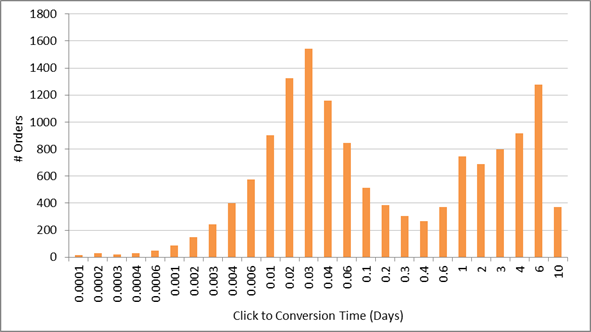
For most advertisers, we see two distinct peaks in the distribution of conversion delay, called a bimodal distribution in statisticians’ terms. The trough portion of the distribution is typically around 10 hours. Below is an example from a retail advertiser’s paid search campaign showing this effect.

The common spread of orders during the day explains much of this pattern, since few orders are placed between midnight to 7 am. The first peak corresponds to buyers who make the purchase within the same day as the ad click, while the second peak consists mostly of those who slept on the decision.
Click-to-conversion time, when taken alone, may be of limited value to marketers. However, things start to get interesting very quickly once we start analyzing its relationship to key performance indicators (KPIs).
Conversion Lag Vs. Order Value
For instance, order value is one metric that intuitively seems to be affected by conversion delay – customers may require a longer consideration time to pull the trigger on a more expensive order.
Plotting order value vs. click-to-conversion time for the same advertiser, we see the pattern below where each blue dot represents a separate order. We see that the split between same-day and delayed orders is again evident:

The benefit of having these two distinct groups is that it makes possible certain analyses that will be difficult otherwise. A common issue when trying to analyze the relationship between click-to-conversion time and any other metric is the existence of an attribution look-back window, which filters out conversions that occur beyond a certain number of days from the ad click. This lost data precludes many statistical analyses.
However, having a bimodal distribution allows the use of clustering techniques to extract only those orders that belong to the first peak of orders, the same-day converters as circled above, which is not plagued by the look-back cliff problem.
Conversion Lag Is Longer For Higher Value Orders
In the case of this advertiser, the results of our analyses gave the following result:
For same-day converters, the click-to-conversion time increases by 42% for every tenfold increase in order value.
This means that if a customer takes 1 hour to decide on a purchase of $10, he/she will take approximately 85 minutes to place an order of $100, around two hours for an order of $1000, and so on.
Delayed converters have a 15% greater order value, on average, compared to same-day converters.
The exact ratio will vary based on the type of products offered. For another advertiser, the average order value of delayed converters was more than twice that of same-day converters.
The results show that though the likelihood of conversion may drop off with time, those that do convert after a longer delay have a higher expected order value.
This is just a glimpse of how insights from advertising data can be used effectively for informing audience segmentation on retargeting and real-time bidding (RTB) campaigns, as well as for driving dynamic user experiences based on past visits and browsing behavior.
Please leave a comment and share any interesting behavioral analyses you have done using advertising data.


Comments