
Identifying Customer Lifetime Value Trends In AdWords
- Fahad H

- Nov 29, 2013
- 3 min read
While search marketers can easily track the number of conversions they’re getting through AdWords, it usually takes more time and effort to delve into the customer lifetime value (CLV) numbers, i.e., a prediction of the net profit attributed to the entire future relationship with a customer.
In this post, I’ll touch on a basic way to look at those CLV numbers in AdWords for those conversions you are currently monitoring: number of purchases, newsletters sign-ups, downloads, or any other proxy metrics.
The Cookie Window Issue
First of all, you need to figure what cookie window is currently being used in your AdWords account. By default, AdWords has a 30 day conversion window; however, this can be modified in “Tools and Analysis –> Conversions.” Just keep in mind past conversions aren’t affected when updating this setting.

Long story short, even if this setting was set to 90 days in AdWords, the true CLV numbers are likely to require a more sophisticated tracking solution in order to look at one year of data — or perhaps even longer, depending on the average conversion cycle duration.
From my experience, though, a 30-day cookie window is long enough to start seeing some reasonably significant CLV trends in your account.
First Steps Into Customer Lifetime Value Analysis
AdWords conversions are typically counted in two different ways: “1-per-click” refers to once per ad, while “many-per-click” will count multiple conversions within the conversion window you are using. As a result, you can look at the average percentage difference between the “Conv. (many-per-click)” count and the “Conv. (1-per-click)” count. This will indicate whether users converted just once or multiple times within your conversion window.
A simple and efficient way to go about it is to use AdWords’ labels in your account in order to aggregate similar data together. For instance, for an e-commerce advertiser:
Brands: keywords containing product brand names
Product-specific: product-specific keyword
GDN: Google Display Network
DSA: dynamic search ads
PLA: product listing ads campaigns
Generic: generic keywords (no brand names, nor trademark terms)
Trademark: trademark keywords
Holiday: seasonal holiday keywords
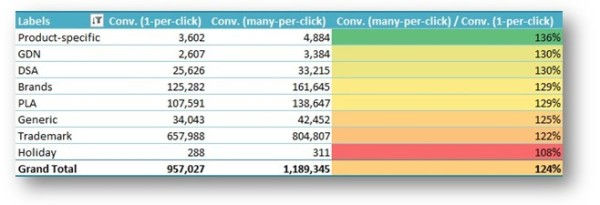
Below are some sample numbers I have put together looking at one year of AdWords data using a 30-day conversion window for an e-commerce advertiser:
Identifying CLV Trends
Just to name a few — below are a couple of findings from the AdWords data above:
The overall Conv. (many-per-click)/ Conv. (1-per-click) ratio is 124%, meaning that an additional 24% of conversions occurred after the first conversion within the 30 day lookback window.
Holiday keywords show the worst ratio (108%), most likely reflecting the “bargain hunt” type of consumer behavior during the holiday season.
Trademark terms (122%) show a ratio that is slightly below the account average (124%), most likely because those users are already returning customers.
All other categories of keywords show higher ratios, including product specific keywords, GDN/DSA/PLA campaigns, and generic keywords. This most likely could reflect a higher proportion of new customers than average (would need to be verified, though).
While those basic CLV numbers are just trends within a 30-day lookback window, it is noteworthy that similar trends can be seen looking at a 365-day lookback window using the proprietary software we use at my agency.
Conclusion
There are lots of ways to go about analyzing CLV, and ideally, marketers should not only analyze those basic paid search numbers using a longer than 90-day lookback window, but also across multiple channels, which will require more advanced tracking solutions.
However, this basic approach in AdWords seems to be indicating reliable trends in general – at least for the sole paid search side of things.
The next step is definitely to move away from channel-specific data. Instead, you want to look into user-centric data and understand how unique users behave across all channels and devices over time.


Comments