
2015 Video Industry Recap: How It’s Growing, Where Budgets Are Going & Top Adopters By Industry
- Fahad H

- Oct 21, 2015
- 3 min read
Three new video reports from AOL, Demand Metrics and the Web design search engine Crayon all confirm what brands, agencies and publishers already know: video continues to be the shining star of marketing content.
While AOL’s 2015 US State of the Video Industry survey focuses on budgets, programmatic and branded video content, Demand Metrics reports on how many brands are measuring video’s overall effectiveness, where brands are hosting videos and the types of video content being produced.
Crayon’s report analyzes major brand websites to identify how many companies include videos on their home pages and how they’re being hosted.
Here’s a quick recap of the three reports.
AOL 2015 US State of the Video Industry
AOL surveyed 300 brands, agencies and publishers to determine how video budgets are growing, where the money is going and trends around branded content.
According to AOL’s findings, of the survey participants who plan to move their TV spend to digital channels, 88 percent are pushing the money toward digital video, with mobile video budgets growing 18 percent since 2014.
Percentage Of TV Budgets Shifting To Video
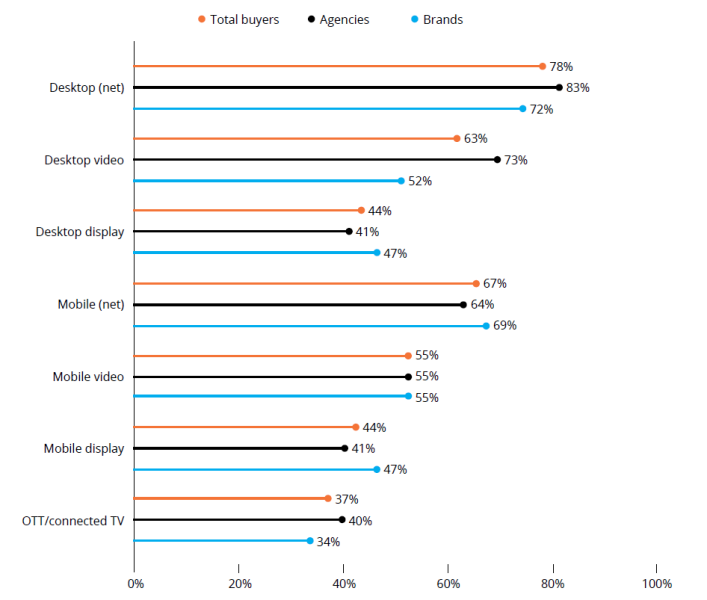
Compared to 2014, AOL reports half of all buyers increased mobile video budgets, on average, by eight percentage points this year. AOL says publishers are seeing the results of this growth, with 24 percent of overall digital revenue coming from mobile video.
AOL’s survey participants listed attribution and measurement as their biggest challenge with mobile video, followed by cross-device targeting.
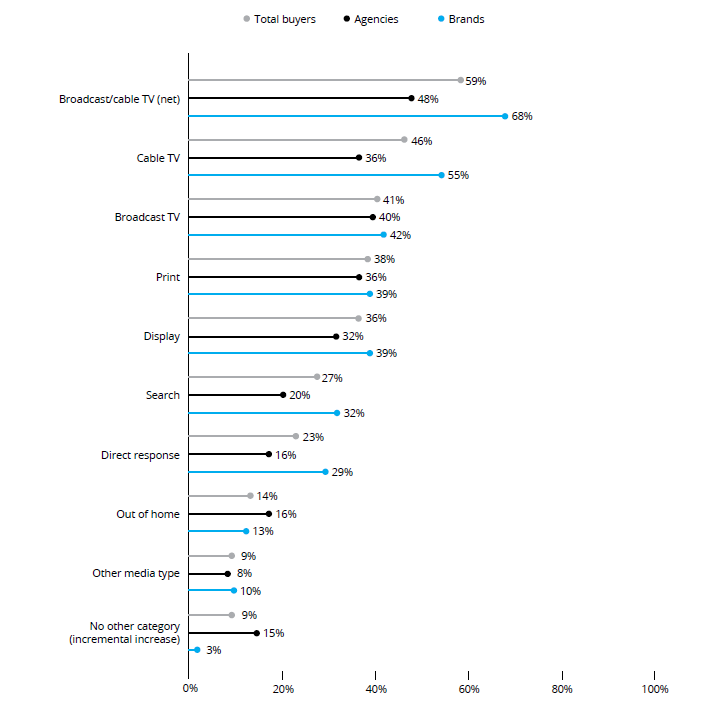
Forty-six percent of the brands surveyed by AOL say they are producing branded video content, with more than half planning to increase budgets allocated for branded videos by 10 percent, on average.
Both buyers and sellers listed cost as the top obstacle for branded video content. To fund branded video efforts, most publishers, agencies and brands are moving dollars from broadcast and cable TV budgets.
Percentage Of Buyers Shifting Budgets To Fund Branded Video Content
Much of AOL’s report focused on programmatic trends, revealing that 91 percent of buyers say they have purchased digital video programmatically. The findings show that agencies are more likely to buy programmatic than brands, with 67 percent of agencies planning to increase programmatic video buying versus 49 percent of brands.
Eighty-eight percent of publishers surveyed say they sell video ad inventory programmatically.
Demand Metrics 2015 Video Content Marketing Report
Sponsored by Vidyard, the Demand Metrics survey included a small selection of respondents, with findings based on responses from 174 survey participants across a range of company sizes and industries.
The report offered a look at how companies value video, with 90 percent of survey participants agreeing video is becoming more important and 69 percent predicting their video content budget will continue to grow.
The most surprising findings from the Demand Metrics report revealed 72 percent of the survey participants said they are either not measuring their video content effectiveness or are only using basic metrics.
Video Content Effectiveness Measures in Use
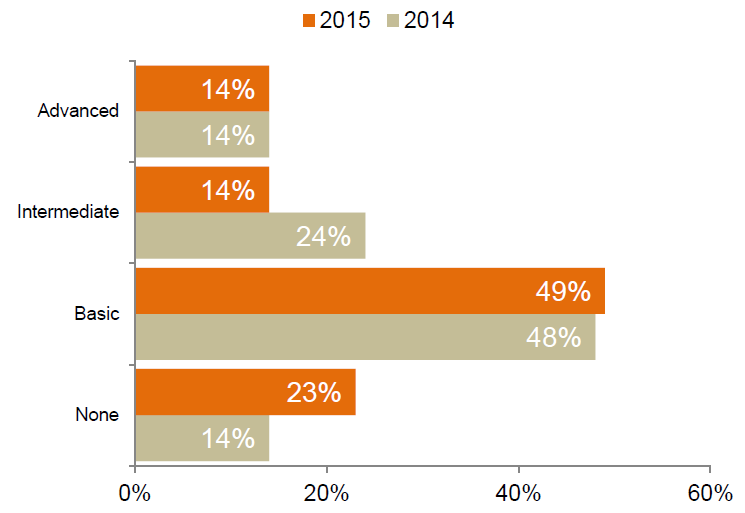
Demand Metrics defined “basic metrics” as those that are easy to capture, such as views or shares. Intermediate and advanced metrics included calculations that are more difficult to determine, like viewing duration, viewing behavior, embed location and drop-off rates.
While fewer than 30 percent of the survey respondents were using intermediate or advanced video metrics, 74 percent of participants reported that video converts better than other type of content. According to these numbers, marketers are convinced video converts, but very few are taking the time to understand why or how.
Demand Metrics found 81 percent of marketers use video content on their websites and 76 percent on social media.
Where Video Content Is Being Used
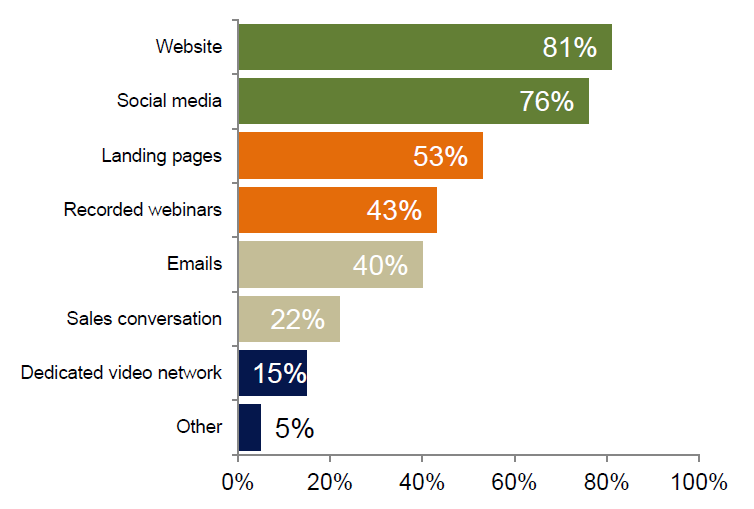
More than half of the companies represented in the Demand Metrics report claimed to produce anywhere from five to 50 marketing videos a year. The top three types of video content included explainer videos, product feature videos and customer testimonials.
Crayon’s 2015 State of Video Report
A search engine built specifically for Web designers, Crayon analyzed video content from 50,000 top brand websites. Using Alexa.com rankings, the report focused on the sites with the highest amount of traffic — identifying how many included videos on their home pages and the how the videos were hosted.
According to Crayon’s findings, 16 percent of of the sites featured a video on their home pages. Of the sites that included a video on their home pages, 27 percent featured more than one video. It was a nearly even split between the number of companies using autoplay videos (49.8 percent) and those disabling the autoplay feature (50.2 percent).
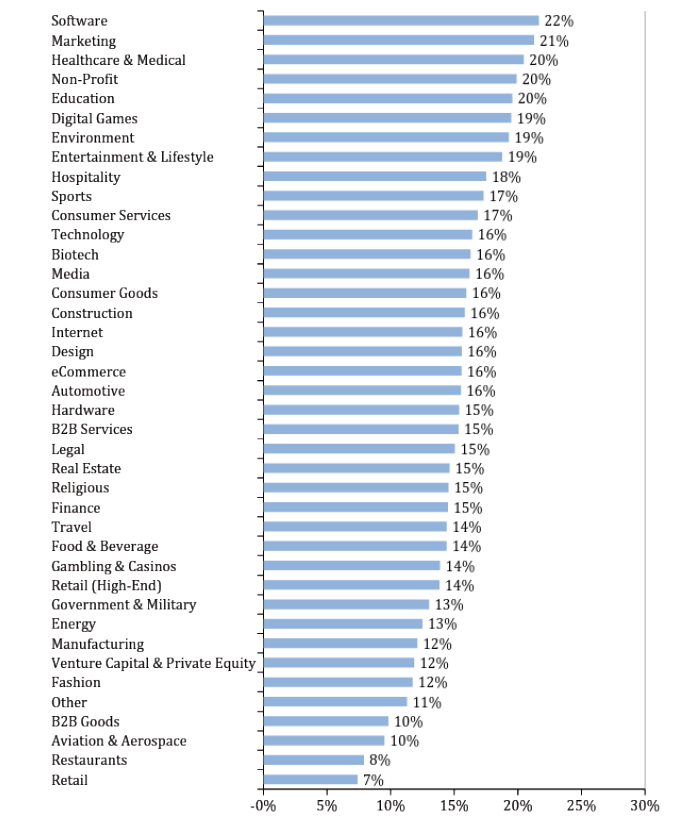
Software, Marketing and Healthcare & Medical industry websites were most likely to include videos on their home pages. Retail industry websites were the least likely to adopt videos on their homepages.
Homepages Featuring Videos by Industry
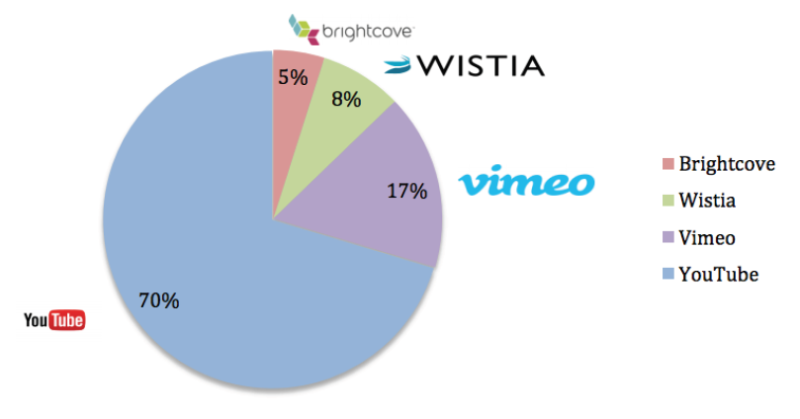
Of the companies with videos on their home pages, 21 percent were using an in-house video platform; the remaining 79 percent opted for a third-party solution like YouTube, Vimeo, Wistia or Brightcove.
The large majority (70%) of sites using third-party platforms were using YouTube.
Third-Party Video Hosting Market Share
You can download each of the reports via the following links:


Comments