IAB & PwC: Online Ad Spending Resumed Pre-Recession Growth Rates In Record 2011
- Fahad H

- Apr 18, 2012
- 2 min read
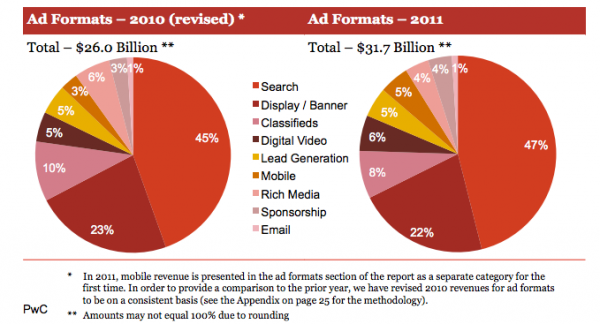
Online advertising spend topped $30 billion (coming in at $31.7 billion) for the first time in 2011, with a 22% growth rate over 2010, marking a return to pre-recession rates of growth. The Interactive Advertising Bureau (IAB) and Pricewaterhouse Coopers (PwC) today released revenue numbers for the full year of 2011, which also included the best-ever $9 billion quarter in Q4.
For the first time, spending on Internet advertising has surpassed that on cable television, with both national and local revenues accounted for. And cable television is one of the only categories showing positive growth besides online.

The numbers confirmed that mobile and video are becoming significant forces in the industry, though they still represent a relatively small piece of the pie. Mobile showed the fastest growth in all categories, rising 149% in 2011, to $1.6 billion from $0.6 billion in 2010. Digital video, a subset of display, rose 29% year-over-year, to $1.8 billion in 2011, as compared to $1.4 billion in the previous year.
Search still represented the largest share of interactive ad revenues, and its share has continued to grow, to 46.5% from 44.8% in 2010. Search revenues grew to $14.8 billion in 2011, up nearly 27%, from $11.7 billion in 2010.

Display grew, too, by 15% year-over year, going from $9.6 billion in 2010 to $11.1 billion in 2011. Display represents 34.8% of overall ad revenues. For the IAB/PwC study, display encompasses banner ads, video, sponsorships and rich media.
Email stayed steady, in terms of a percentage of spend, from 2010 to 2011, at 0.7%. In dollars, it went from $195K to $213K. Lead generation and classified and directories saw their share of spend go down from 2010 to 2011.

The Retail category continued to spend the most in online advertising, the report indicates, with financial services and automotive coming in second and third. It’s interesting to note, however that while certain categories — Retail, Financial Services, Leisure Travel, and Media — showed at least slight increases in spending, other categories stayed the same or showed drops. Telecom, Automotive, Computing Products, Consumer Packaged Goods, Pharma & Healthcare and Entertainment were the categories stagnating or declining.

Those who are spending are increasingly doing so on a performance basis, with approximately 65% of revenues priced on performance, up from 62% in 2010. CPM pricing dipped from 33% of spending in 2010 to 31% in 2011. Hybrid pricing also saw a decline, falling to 4% in 2011 as compared to 5% the previous year.


Comments