5 Steps to Tracking and Monetizing Your Website Conversions
- Fahad H

- Oct 6, 2011
- 5 min read
I’d like to see a show of hands: How many of you have Google Analytics installed on your websites? Most of you? Great!
How many of you have at least one “goal” set up within your account to track your conversions? Ok, I probably just lost about half of you.
Final question: How many of you have a monetary value or “goal value” attached to that conversion goal? Anyone? Anyone? Bueller?
In my last post, I showed how to create “conversion paths” within your website’s content to help site visitors complete your desired outcomes. Now I’d like to show you a basic method for adjusting your Google Analytics settings so that you can start answering the following:
Is my website content driving conversions?
Which pages in those conversion paths are not “getting it done”?
How much is a conversion actually worth… in dollars?
Which inbound marketing activities are delivering quality traffic that converts?
Which social networks are driving conversions?
Key question — How much more marketing budget can I ask for next year based on how well I made the connection between online marketing and revenue?

A note before we dig in… I’ll do my best to keep my “geek-speak” to a minimum.
Step 1: Every path has an end
As we are structuring our conversion paths and overall content architecture, most of us are probably trying to guide a website visitor to some sort of end point, such as filling out a lead form, making a product transaction, or even requesting a membership subscription. When a visitor completes your desired action, the standard practice is to send him to a confirmation or Thank You page. From a Google Analytics standpoint, this confirmation page is the true end point. And the URL of that page will be your Goal URL, which we’ll address in Step 3, below.
Note: To follow my process, you’ll need to be able to get to that final page URL. So if you’re actually walking through the process while you read this article, do whatever you need to do to get to the Thank You page (dig into your website files and templates, or just complete the conversion yourself). When you get there, copy the URL to your clipboard.
Step 2: What is each conversion worth in dollars?
Anyone good at fuzzy math? I say that because tracking actual ROI in Google Analytics, down to the dollar, is fuzzy at best. We’re really just trying to get a general sense of how your website is performing, using lead-to-close ratios and average transaction amounts, so that you can start “sniffing dollars” (as Jay Baer says). Let me throw out an example here with simple round numbers.
Let’s say your company sells a variety of products, and your average sale amount is $1000 (per transaction). You have a lead form on your website that starts your sales process. Historically, your lead-to-close ratio has been a steady 10 percent, meaning that out of 10 lead form submissions, one of them results in a sale. With these numbers, we can now calculate your average goal value:
$1,000 / 10 = $100
So, despite the other nine leads not closing, each lead is still worth $100. Now it’s your turn. What is your average transaction amount? What is your historical lead-to-close ratio? Some of these numbers might be hard to come by if you’re residing in a data-poor environment. But even a conservative ballpark figure is better than leaving the goal value blank in Google Analytics.
Step 3: Set up your goal in Google Analytics
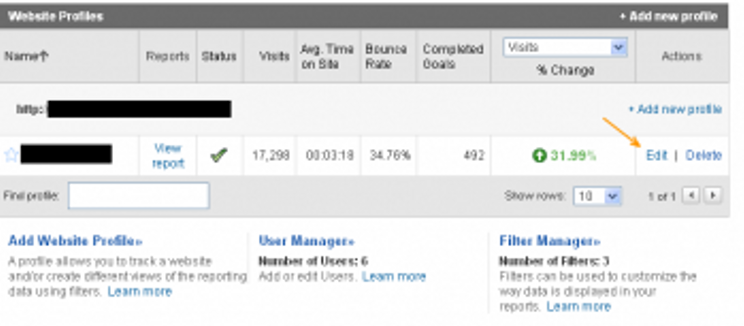
If you’ve never set up a goal before, the goal set-up function is located on your Profile Settings page, and you’ll need to be an administrator on your account to access it. From your Analytics Settings page, click Edit to edit your desired website profile.

On your Profile Settings page, look for the Goals section in the middle of the page, and click Add Goal to create your first one (or Edit if you’ve previously created a goal).

The Goal Settings page can get a little tricky for non-tech folks, but below are the key items that need to be filled in correctly in order for your conversion goal to be tracked properly:
Goal Type. If you’re going with the confirmation page scenario, choose URL Destination. Other options are available as well.
Match Type. Some website URLs are more complex (dynamic) than others, so you need to tell Google Analytics what to look for. Click the little question mark next to that label for instructions. When in doubt, call your local web geek.
Goal URL. If you still have that URL from Step 1 on your clipboard, click paste. If not, copy the URL from your Thank You / Confirmation page and paste it in the Goal URL field. Delete the actual domain name portion of the URL per the instructions on the right.
Goal Value. Enter the goal value that you calculated for your specific situation.

With those settings in place, Google Analytics is now going to start tracking both your conversion volume and the average dollar amount to which this equates.
The final piece of this set-up process is to create your goal funnel. If your conversion path is set up to guide visitors through a sequence of pages, you’ll want to set up that step-by-step (or page-by-page) sequence as a funnel so that you can track both the success and failure of your conversion path. The screenshot below shows a typical shopping cart funnel that starts at the View Cart page.

With your sequential funnel set up, now Google Analytics is going to tell you how often people are jumping ship (the abandonment rate) and on which pages they are exiting most. This is very valuable data that should raise some red flags regarding the content on certain pages. You might need to do some testing or make some content tweaks to address the reasons visitors leave on these particular pages.
When you’re done, hit Save.
Step 4: Establish benchmarks, track trends

As I mentioned above, tracking actual dollars through Google Analytics might be fuzzy for some of you, but the important thing is to establish your baselines and start analyzing trends over time. You should be doing regular month-over-month, quarter-over-quarter and year-over-year comparisons, just like your sales manager or CFO. Google Analytics makes it very easy to adjust your date parameters (shown above) and compare past date ranges (shown below).

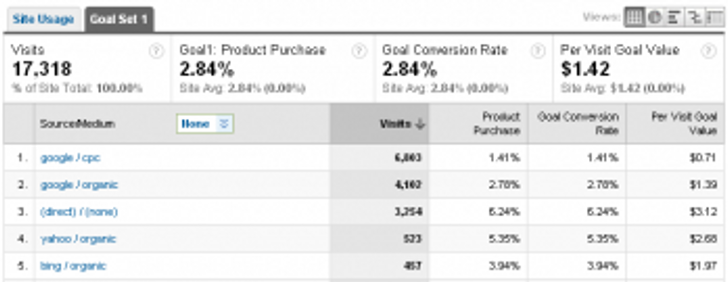
BONUS! – With your conversion goals and goal values in place, you’re now going to be able to drill down into your traffic sources and see which sources have the best conversion rates and the rough dollar amount that they are generating in sales.

In the screenshot above, we can see that Yahoo and Bing are bringing fewer visitors but more buyers to the site than Google organic or PPC. Hmmm…
Step 5: Close the ROI loop
In setting all this up, my goal is to equip you and your decision-makers with real-time data that will help you make smart, data-backed decisions regarding where and how much budget / resources should be allocated to your website and various online marketing efforts in the future (or to justify what you’re spending now!).
Your homework
Put a date on your calendar every month (or every week) to sit down and review your Google Analytics data. Adjust your date parameters to do a month-over-month comparison and identify opportunities for improvement. Look at your traffic sources and keywords to help guide your social media and content development / SEO efforts. Then go show your boss (or your clients) how your hard work and great content is paying off.


Comments